 DataLila
Uncover the stories your data can tell.
Uncover the stories your data can tell.
DataLila is a service that provides a natural language interface to your data.
The state of the art in this space is advancing quite rapidly, with new papers and projects being announced almost every week! We bring the best of these advancements as a custom implementation for specific use cases relating to your data and custom schema.
Your data, or metadata, never leaves your premises! Amplify the value you derive from your data!
Where We Are:
We are a team of data scientists who leverage the bleeding edge Data Science
and Machine Learning techniques to help our customers derive insights from their data to
help answer complex data queries.
Where We Are Headed:
Our aim is to develop an On Prem / Local solution that enables a
natural language interface to your data. Get completely reproducible, explainable results and
visualizations in seconds!
“How was the performance at product level for the month of Sep'23 comparing the same with Budgets & Previous year?”
- Identify Key Terms
- ‘Performance’
- Based on knowledge of the database schema, key indicators for ‘Performance’
could
include the following columns:
- Net Profit
- Gross Sales
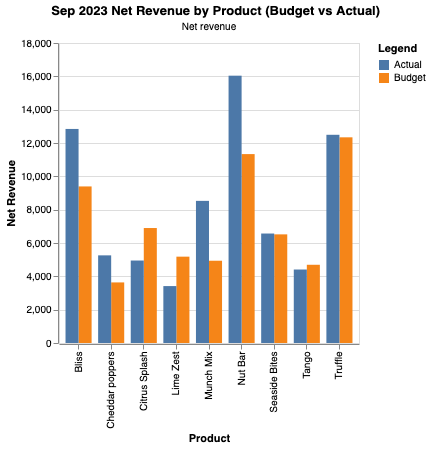
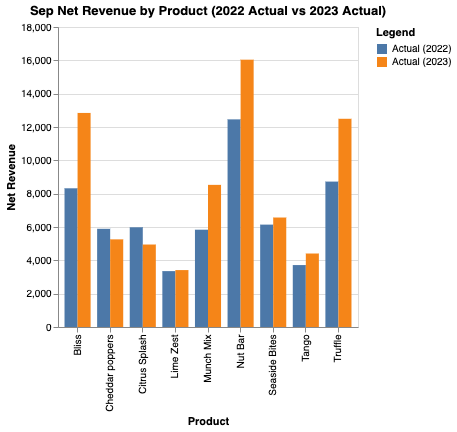
- Net Revenue
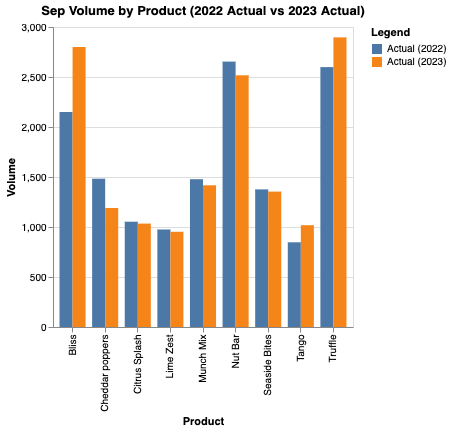
- Volume (Only seen in the ‘Actual’ sheet)
-‘Product-Level’
- Comparisons performed in this calculation should be done after grouping the data based
on
each unique product
- Month/Year
- Data should be filtered on the specified month and year
- Identify suitable visualization
- Since the user is requesting a direct comparison of data from different time periods,
generating grouped bar chart visualizations, one for Sep 2022 (Actual) and Sep 2023 (Actual) and one
for
Sep 2023 (Budget) and Sep 2023 (Actual) will best support the answer to the user’s query
- Filter the ‘Budget’ and ‘Actual’ tables on year==2023 and month=='Sep' then calculate the
aggregate sum values for each ‘Performance’ metric and for each unique product. Record and display
each
result.
- Filter the ‘Actual’ table on year==2022 and month=='Sep' then repeat the same aggregate sum
calculations. Record and display the result.
- Calculate the percentage change for 2022 (Actual) and 2023 (Actual) and present the
resulting
table to the user
- Drop the ‘Volume’ column from the 2023 (Budget) and 2023 (Actual) aggregate tables and then
perform the percentage change and present the resulting table to the user
- Using the aggregate tables generated in Step 2, create two combined dataframes, one for each
comparison
- Set the index to be a MultiIndex using the Product Name and Performance Metric
categories
- Using Altair, plot a grouped bar chart for each of the two combined dataframes with the
following encodings:
| Encoding | Value |
|---|---|
| X | Product |
| xOffset | Time Period |
| Y | Aggregate Value |
| Color | Time Period |
| Column | Metric |
- Generate plot
Percentage change in performance metrics from Sep 2022 (Actual) to Sep 2023 (Actual)
| Product | Net Profit | Gross Sales | Net Revenue | Volume |
|---|---|---|---|---|
| Bliss | 68.52% | 47.19% | 54.33% | 30.23% |
| Cheddar Poppers | -18.99% | -8.25% | -10.75% | -19.76% |
| Citrus Splash | 3.70% | 4.36% | -17.30% | -1.8% |
| Lime Zest | 2.39% | 6.77% | 1.86% | -2.36% |
| Munch Mix | 38.93% | 30.28% | 46.07% | -4.13% |
| Nut Bar | 44.82% | 1.92% | 28.75% | -5.16% |
| Seaside Bites | 6.04% | 12.27% | 6.92% | -1.60% |
| Tango | 30.56% | 40.89% | 18.66% | 20.19% |
| Truffle | 22.92% | 28.15% | 43.19% | 11.43% |
Percentage change in performance metrics from Sep 2023 (Budget) to Sep 2023 (Actual)
| Product | Net Profit | Gross Sales | Net Revenue | Volume |
|---|---|---|---|---|
| Bliss | 68.43% | 32.61% | 36.72% | N/A |
| Cheddar Poppers | 6.51% | 37.30% | 44.66% | N/A |
| Citrus Splash | -6.04% | -15.31% | -28.26% | N/A |
| Lime Zest | -24.36% | -15.23% | -34.08% | N/A |
| Munch Mix | 86.94% | 53.55% | 72.77% | N/A |
| Nut Bar | 45.44% | 27.08% | 41.51% | N/A |
| Seaside Bites | 17.07% | 2.62% | 0.77% | N/A |
| Tango | 15.67% | -1.33% | -6.07% | N/A |
| Truffle | 6.87% | 0.91% | 1.23% | N/A |
Comparison Sep 2023 (Budget) vs Sep 2023 (Actual)
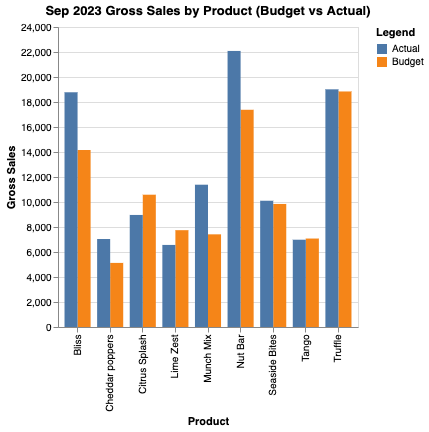
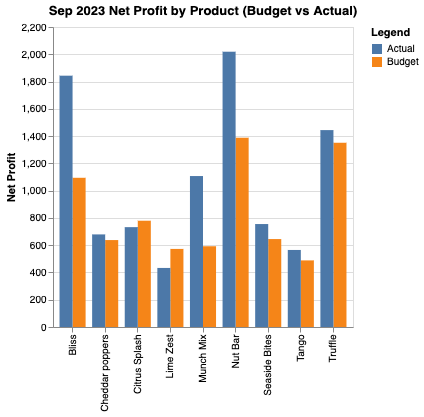
Based on comparisons of Net Profit for each product category, it appears that all products exceeded budget expectations except for Citrus Splash and Lime Zest in September 2023.
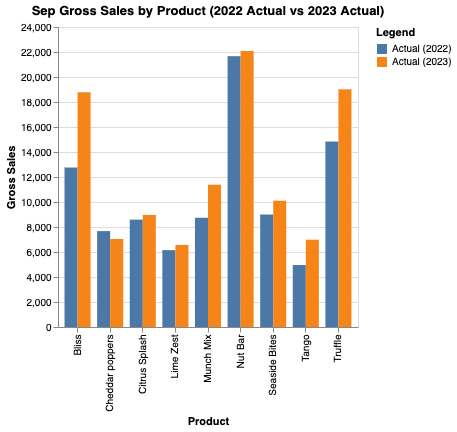
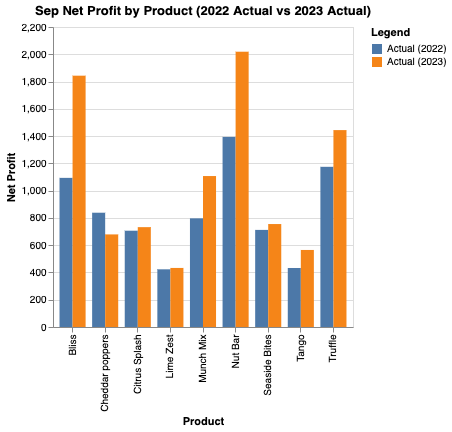
Based on comparisons of Net Profit for each product category, it appears that all products improved their Net Profit for the company from 2022 to 2023, except for Cheddar Poppers which saw a 19% decrease in profits over that time period.
Looking at both comparisons, it looks like the Bliss product showed a nearly 70% improvement when
compared to both the actual performance in 2022 and the budgeted performance for 2023. Cheddar
Poppers,
Citrus Splash, and Lime Zest all showed either minimal increases in performance or significant
decreases, suggesting that they are currently the worst performers in the month of September.
Finally,
Munch Mix and Nut Bar continue to be strong performers.
Welcome to the DataLila Blog section!
This section will contain blog posts, instructional videos, and other helpful content related to the application of Data Science techniques in solving complex business problems.
We are working on adding new content at this time. Stay posted and please contact us by email at info@DataLila.com for more information.
Thank you for exploring the DataLila website!
More workflows, examples and video content will be posted periodically.
Please contact us by email at info@DataLila.com for more information.